2240Views 0Comments

Ethereum Classic (ETC) Turns Tables With 100% Gain in 15 Days!
Ethereum Classic has often found itself in deep corners since the limelight was captured by Ethereum, denoted by the code ETH. As such, Ethereum Classic was named ETC. Since the beginning of 2022, ETC has already lost a massive chunk of its value and has fallen from $77 levels to $22.
Since the beginning of 2022, ETC’s price action has improved slightly, with value hitting close to a 100% gain. This sudden spike has helped shorten the gap between August 2021 and May 2021, high within a 35% decline.
Ethereum Classic will have to keep moving above to become trending in the coming days. ETC at present carries a market capitalization of $6,698,860,286, including only 64% of tokens in circulation. Ethereum Classic now ranks 28th in terms of market capitalization size and carries ahead the original legacy of Ethereum Blockchain.
The fact that Ethereum Classic chose to preserve the original ETH blockchain without countering the DAO hack that left a hole of $60 million Ether. Since ETC developers and backers have opted not to turn it into a for-profit entity, users pay gas fees that the miners earn without incorporating the need or demand for further governance.Breaching out of its downtrend slumber, Ethereum Classic gets a massive value gain in just two weeks. With prices climbing up from $24 to $50 and above, it would be hard for resistances to put pressure and keep the value from reaching its maximum potential. Check out the best Ethereum Classic price prediction to know the most prominent resistance and support levels.
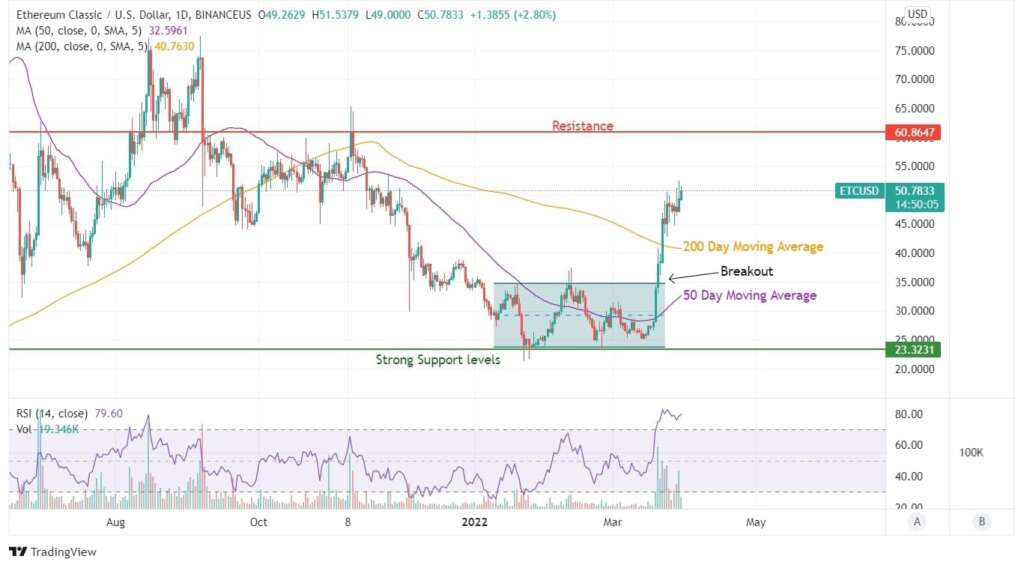
Ethereum Classic took a drastic turn with its swift breakout after surpassing the 50 DMA curve on its third attempt. Thus, ETC prices spiked to new heights that outweighed price gain by market leaders in the same time frame. At $50, ETC has an immediate resistance in the shape of previous levels that marks $60 on charts.
Further to this level, consolidation near $80 levels would be needed for adding wings to the already upside trending price action. As we can witness, the RSI has breached overbought zones, now trading close to 80 levels; there will be a small profit booking but of a small tune.
In longer time frames, the price trend could offer deeper insights. Here the support seems to have been last capped at $24 levels. 200 DMA curve of ETC trades at $40 while the short term moving average of 50 Days trades at $32.
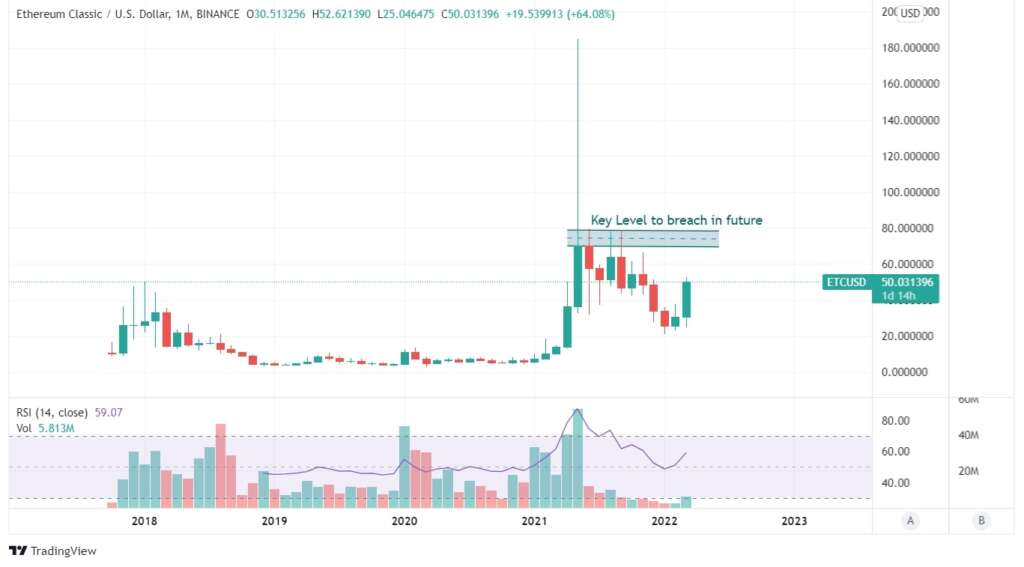
ETC price trend on monthly charts does offer some insights into its price action. Value gain we witnessed in 2021 seems to be artificially pumped to new heights from any created hype. But the support from its recent levels that matches the perks of 2018 levels offers a different perspective on this price action.
ETC showcases the potential to reach new highs only after the candle manages to surpass $80 levels and sustain over a longer term.